April 2022 VMware Multi-Cloud Briefing

The VMware Multi-Cloud Briefing is an online quarterly series, in its fifth iteration, that brings vision, technology, and customer stories to the table. The briefing series has evolved through cloud platform, operations, and application development since its introduction in the summer of 2020. Both cloud technology and cloud adoption is advancing at a fast pace, and this April briefing provides an opportunity to see what’s new directly from VMware engineering, independent industry experts, and customers.

The latest session is opened with Joel Neeb, VP Execution and Transformation, VMware, and former F-15 pilot. Joel will talk through the history of aviation and the advancements in the cockpit, from having limited technology to running over 300 different instruments. With so many new features and capabilities, there comes a tipping point where it cannot be practically managed by a single operator, or it takes more time than it offers value. These instruments are now streamlined into a handful of features, displayed on screens instead of through switches and dials, with the computer systems surfacing what’s important to the operator at a given time.

We can learn from this approach, and apply similar models to be able to abstract and simplify multi-cloud complexity across different environments and locations. VMware Cross-Cloud Services can remove complexity, whilst enabling the agility of different cloud providers and the freedom to choose the right target environment for each application. Offering standardisation and consistency at the infrastructure layer allows scale and flexibility. Then, as requirements change and new use cases are uncovered, IT teams and developers can move quickly to accelerate overall business transformation.

VMware Cross-Cloud Services

The session continues with quick fire customer stories around streamlining operations with VMware technology, and a customer interview with S&P Global covering their approach to solving multi-cloud complexity. Later, we’ll also hear a partner perspective from DXC Technology, on how they work with customers to deliver multi-cloud outcomes, and what trends they are seeing across the market.

Next is a technology deep dive, starting out with examining how we’ve arrived at the complexity of running environments across public cloud, private cloud, and the edge. You can then expect to see:

  • How easy it is to add a new VMware environment to a hyperscaler, using vRealize Automation. In this demo we’ll start with an on-premises hosted environment, and scale out by spinning up new environments in the cloud, with the same management tooling and policies.
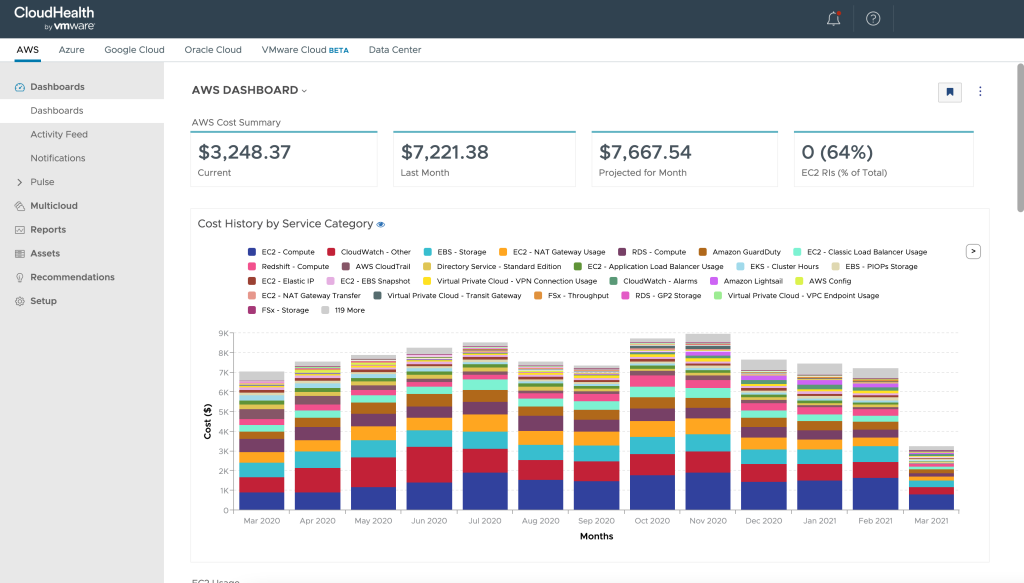
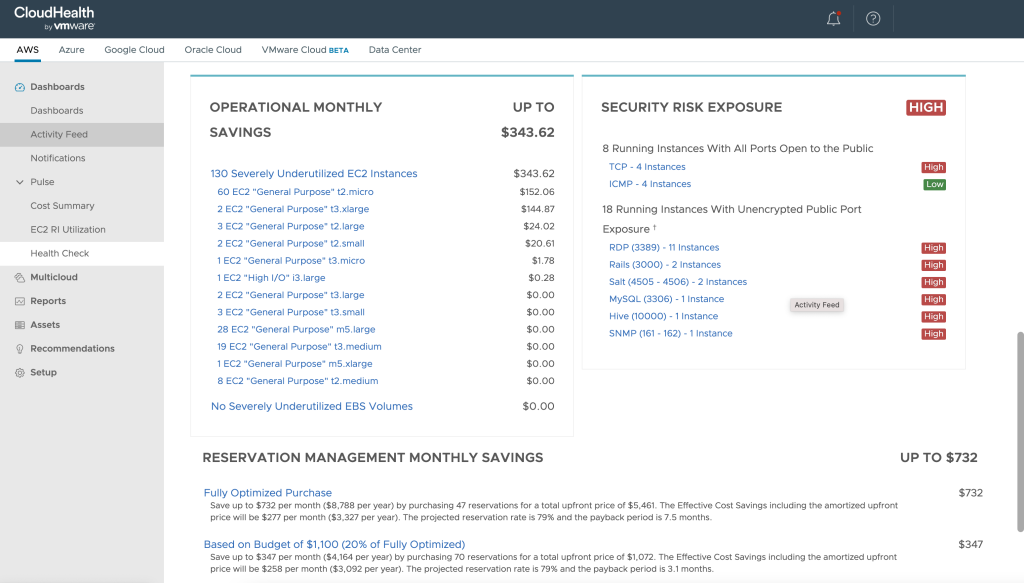
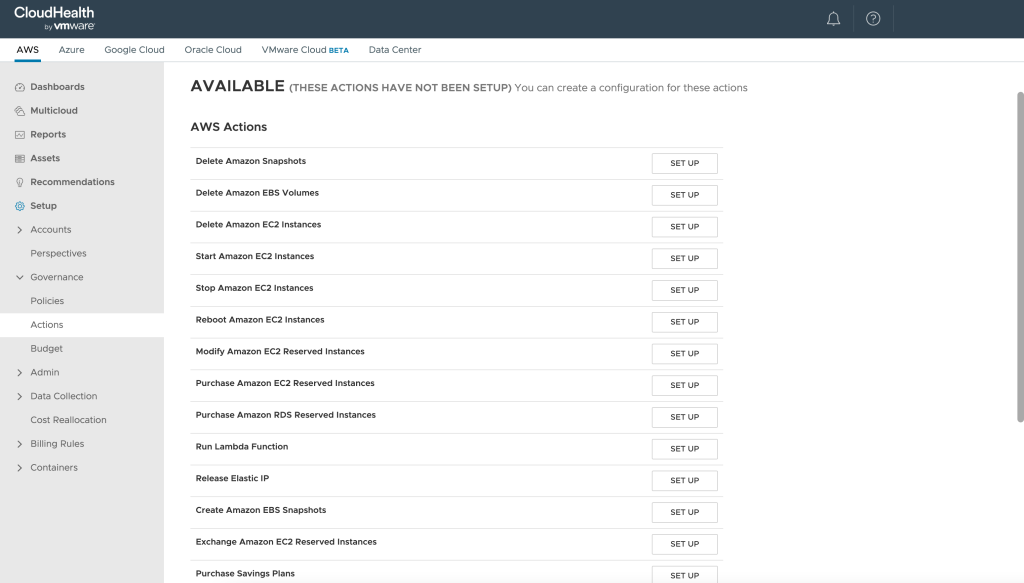
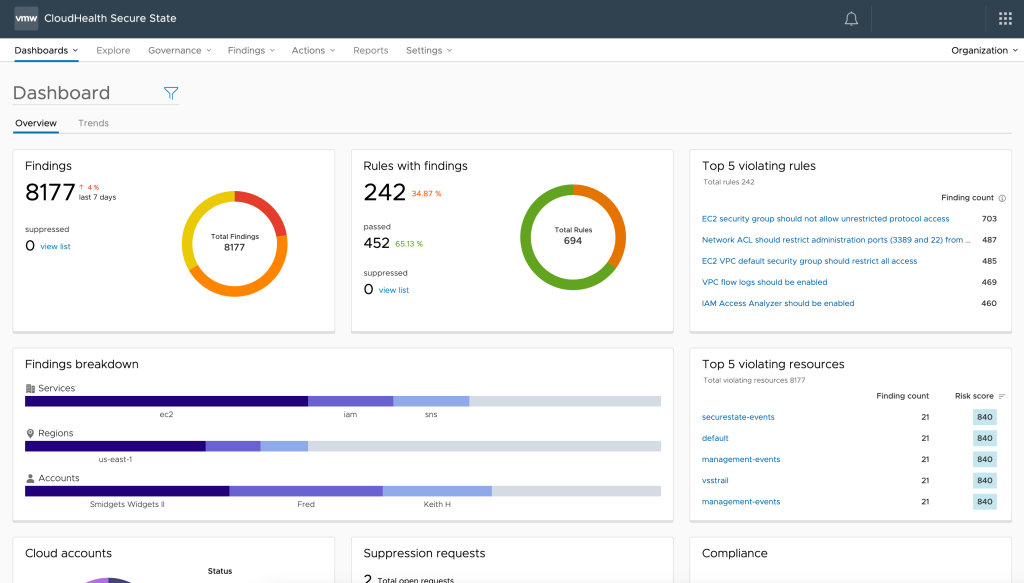
  • How to manage multiple cloud environments from a single tool, using vRealize Operations. In this demo we’ll look at a consistent way of managing and optimising resources, performance, capacity, and costs, with a unified troubleshooting interface.
  • How to add Kubernetes clusters in different hyperscalers to a common management plane, using Tanzu Mission Control. In this demo we’ll see how you can standardise the management of Kubernetes services, which will likely compliment your existing virtual machine infrastructure. Furthermore, we’ll find out how Tanzu Service Mesh can secure the communication of micro-services between environments and across clouds. Tanazu Service Mesh is able to bring micro-services under the same security umbrella, and automate features like mutual TLS encryption across all services.

The final segment is an industry interview with IDC and VMware, talking about what it means for customers to standardise their infrastructure and cloud platforms. There are multiple layers of abstraction and standardisation, covering the likes of management, optimisation, and security. IDC will detail where you can start, and what they see as good first steps.

The April 2022 VMware Multi-Cloud Briefing, and associated launch blog, is now live and available on YouTube. The video is embedded below. You can watch the current and previous briefings on the VMware Multi-Cloud Briefing page, each video is between 30-40 minutes long.

VMware Multi-Cloud Briefing April 2022

VMware Skyline Advisor Pro Overview

Introduction

Skyline Advisor Pro is a cloud-based, pro-active, support technology that helps VMware customers avoid issues before they occur. It automates the capture and analysis of configurations, support bundles, and trend telemetry, and provides granular visibility throughout the global environment with predictive and prescriptive recommendations.

As well as proactive avoidance of downtime, Skyline also monitors and provides remediation guidance for security risks across the VMware estate. IT staff can spend less time fixing issues or manually searching through security vulnerabilities, and more time improving services and aligning to strategic initiatives. If an issue does occur; Skyline also helps speed up the support request resolution, since VMware Global Support Services (GSS) already have visibility into the VMware logs through the Log Assist feature.

How Does Skyline Advisor Pro Work?

Skyline Advisor Pro is setup in the VMware Cloud Services portal. You need a Cloud Services Organisation to activate Skyline, and any other VMware Cloud services. You can create a new org or use an existing one to group your VMware Cloud services together. The Cloud Services Organisation acts as a logical container where you will manage features like identity and access management, subscriptions, billing, and support. Skyline Advisor Pro is included at no extra cost for VMware customers with production and premier support, or vRealize Cloud Universal and Customer Success 360 consumers.

The Skyline Advisor Pro intelligence and user interface is all provided and hosted as a cloud service, known as Software-as-a-Service (SaaS). The Skyline Collector is a small virtual appliance, it is deployed in the customers VMware environment and facilitates the secure connection back to the SaaS control plane. The collector appliance is a standard OVA deployment, and will allocate 2 vCPU, 8 GB RAM, and 1.1 GB thin provisioned disk (or 87.1 GB thick provisioned).

Once the collector is deployed, endpoints for vCenter and other products can be added. Skyline Advisor Pro is able to provide proactive intelligence for vSphere, vSAN, NSX, VMware Cloud Foundation, Horizon, vRealize Automation, and vRealize Operations. After registering endpoints, the Skyline collector automatically and securely collates product usage data. Skyline then analyses the data to identify patterns, events, trends, design-compliance, and cross-product interaction.

Data collected is encrypted both at-rest and in-transit (transmitted back to the Skyline platform using the TLS 1.2 encryption protocol). Access is limited to VMware employees in customer support roles that have undergone full training. Although object names and IP addresses are included in the product usage data, there is no personally identifiable information collected. Skyline is GDPR compliant and certified in SOC2, Cyber Essentials Plus, and others. You can find out more in the VMware Cloud Trust Centre and VMware Skyline Frequently Asked Questions, see also VMware Skyline Data Collection Examples.

Proactive findings and recommendations are presented back to users through the Skyline portal in the VMware Cloud console, or through the vRealize Operations Cloud integration. The availability of the Skyline collector is critical in ensuring visibility into the environment from the Skyline portal. Depending on the size and scale of the environment, you may have multiple collector appliances. You can learn more about the high level architecture in the Skyline Architecture Documentation.

Skyline Advisor Pro Components

What’s New in Skyline Advisor Pro?

Just before VMworld 2021, VMware announced Skyline Advisor Pro. This latest iteration provides a major step forward in user experience from its predecessor, and it’s not just dark mode either. Both functional and operational improvements have been made to the product.

Skyline Advisor Pro significantly accelerates data processing and insights; now surfacing issues and inventory changes within 4 hours. With Skyline, this process was previously taking 48 hours. Further environment insights have been added to Skyline Advisor Pro, such as end of life notifications and historical insights. The Skyline Advisor Pro API now allows users to interrogate findings data with other tools, or trigger events to be sent to collaboration tools or ticketing systems. You can read more about these features in the VMware Skyline Advisor Pro is here blog.

Getting Started With Skyline Advisor Pro

The easiest way to enable Skyline Pro is to follow the Get Started link on the VMware Skyline product page. This will direct you to log into the VMware Cloud Services portal, use your corporate/work account that has an active support subscription aligned. Once logged in you will be invited to create or select a Cloud Services Organisation and activate Skyline, the Skyline administrator role is assigned to your account as part of the process.

The onscreen instructions will allow you to download and link the collector appliance. You can also download the VMware Skyline Collector from the Customer Connect downloads site. When you deploy the OVA to your environment you will be prompted for configuration such as network settings and endpoint registration. For more detailed information see the Skyline Planning and Deployment section of the VMware Skyline Documentation.

After setup is complete the Skyline Advisor Pro panel is added to your available services in the VMware Cloud Services portal:

Skyline Advisor Pro Dashboard

Within the Findings and Recommendations tab you’ll be able to see findings with affected objects, risk, recommendations, and historical data. You can click into each finding for more information, context, and fixes or links to KB articles if applicable.

Another thing to note is that Skyline integrates with vRealize Operations (vROps), either using the management pack for on-premises vROps, or directly for vROps Cloud. To see which features and findings can be pulled into vROps see the Extending Skyline’s Integration with vRealize Operations Cloud via the Skyline Management Pack blog post.

Skyline Advisor Pro Active Findings

How CloudHealth Optimises and Secures Your Cloud Assets

Introduction

Over the past 12 months we have seen further growth within the cloud, as many organisations scale or create new digital services in response to the coronavirus pandemic. Improved speed and agility has allowed businesses to pivot where traditional siloed infrastructure may have caused them to stall.

As the usage of cloud services expands, standardising and consolidating cloud tooling becomes important for financial management, operational governance, and security and compliance. Visibility into distributed system architectures across many accounts or subscriptions, or even multi-cloud, is another key challenge. For some customers cloud workloads are not optimised or configured to best standards, many will spend more than their anticipated budget, and others may accidentally expose data or services.

Those with an established cloud strategy may decide to implement a Cloud Centre of Excellence (CCoE); responsible for cloud operations, security, and financial management. The CCoE will navigate the security and configuration landscape of cloud assets, automating response and remediation to configuration drift or threats. As the team grows in maturity optimisations are made continuously and automatically, inline with the key drivers of the business. This is where CloudHealth comes in.

CloudHealth by VMware is a multi-cloud SaaS solution managing more than $11B of public cloud spend for over 10,000 customers. CloudHealth accelerates business transformation in the cloud by providing a single platform solution for visibility into AWS, Microsoft Azure, Google Cloud Platform, Oracle Cloud Infrastructure, VMware Cloud on AWS, and on-premises VMware based environments. The key functionality is broken down into the 2 products we’ll look at below.

CloudHealth Multicloud Platform

CloudHealth takes data from cloud platforms, data centres, and third party tools for application, security, and configuration management. Data is ingested and aggregated using CloudHealth’s integrated data layer, which performs analysis on usage, performance, cost, and security posture. CloudHealth becomes a single source for multi-cloud management across environments, strengthening security and compliance, consolidating management, and improving collaboration between previously siloed teams of people and tools.

Data and assets can be categorised by tags or other metadata, and viewed in logical business groups known as perspectives . Perspectives provide a breakdown for cost allocation using dynamic groups such as line of business, department, cost centre, or project. The output can be used to identify trends and build dashboards and reports. This approach simplifies financial management, saves time, aids with budgeting and forecasting, and encourages accountability through accurate chargeback or showback.

CloudHealth Cost Dashboard

Whilst visibility is great, to really have a positive impact on operations we need to know what to do with the data collected. CloudHealth presents back cost optimisation recommendations and security risks, but can also carry out remediation actions automatically.

Cost optimisation is where you can save money, using AWS as an example, based on things like; EC2 instances that are oversized or on an inefficient purchase plan, elastic IP addresses or EBS volumes that are not attached to any resources, snapshots that have not been deleted. In the physical on-premises world all of these issues were common as part of VM sprawl, they impacted capacity planning and resource consumption but were mostly hidden or swallowed as part of the wider infrastructure cost. As organisations shift from large capital investments to ongoing revenue and consumption based pricing, oversized or unused resources literally convert to money going out of the door every single month.

CloudHealth Health Check

Recommendations and actions are where CloudHealth carries out remediation for incorrectly configured or under-utilised resources. Policies can also be used to define desired states and ensure operational compliance. For example, an organisation may want to report on untagged resources, connected accounts, or open ports. The number of available actions currently appears to only cover AWS and Azure, but with support recently added for Oracle Cloud Infrastructure, and Google Cloud Platform before that, hopefully this functionality will continue to be built out.

CloudHealth Remediation Actions

At the time of writing CloudHealth is priced based on cloud spend, and can be purchased as a 1, 2, or 3 year prepaid commitment, or variable pricing based on the previous months cloud spend. A free trial is available to uncover ROI in your own environment from CloudHealth here.

Where VMware environments are in use with vRealize Operations, the CloudHealth management pack for vRealize Operations can be installed. Bringing CloudHealth dashboards and prospects into vROps allows IT ops teams to track on-premises infrastructure and public cloud costs from a single interface. The CloudHealth management pack for vROps can be downloaded from the VMware Marketplace, instructions are here.

CloudHealth Secure State

By default CloudHealth provides real-time information on security risk exposure, but for deep-dive visibility and remediation those who are serious about security will want to look at Secure State. CloudHealth Secure State is available with CloudHealth or standalone, and currently supports AWS, Azure, and GCP.

Dashboards within CloudHealth Secure State enable at-a-glance checks on security posture and compliance. There are over 700 built-in security rules and compliance frameworks that can be used as security guardrails, with the ability to add custom rules and frameworks on top.

As systems become distributed over multiple accounts, subscriptions, or even clouds, the dynamics of securing an organisations assets shift significantly. Previously all services were contained within a data centre, firstly using perimeter firewalls and then with micro-segmentation. IT teams were generally in control and had visibility throughout the corporate network. Nowadays a developer or user responsible for a service can potentially open applications or data to the public, either on purpose or by accident. Cloud security guardrails form an important baseline for security posture and cloud strategy. Security guardrails are made up of critical must-have configurations in policies with auto-remediation actions attached, they help avoid mistakes or configuration drift to ultimately reduce security risk.

CloudHealth Secure State gives further visibility into resource relationships and context, using the Explore UI. Explore enables a powerful model of multi-cloud or account architectures, with visual topology diagrams of complex environments. Cyber security analysts or operations centres can drill down into individual resources with all interoperable components and dependencies already mapped out.

CloudHealth Secure State Dashboard
CloudHealth Secure State Compliance

Featured image by Scott Webb on Unsplash